Measuring Social Media Beyond ROI

Measuring tape unravelledMarketing managers want tools for measuring social media ROI but the answer may be found in recognizing patterns, reporting on results and establishing closed-loop business models.

Tools can measure quantities but interpreting patterns may be your best bet in substantiating your efforts. In his four part series on measuring social media, J. Michael Roach at Kimbermedia summarizes ways to obtain information/analytics on social media interactions. He covers Facebook (Insights), Twitter (www.twentyfeet.com), LinkedIn (Page analytics) and Google (Google analytics). Obtaining and understanding the data requires monitoring and evaluation. He writes “…notice how different types of content will generate more interest than others.”

In his recent post, 5 Ways to Measure Results of B2B Social Media, Jeffrey L. Cohen expresses the importance of measuring and reporting on social media results. He says it determines success and shows value. I would add another reason: show where improvement can be made. He advocates measuring followers, conversions, leads & sales, cost savings and ROI to get a clear picture.

Giselle Abramovich celebrates the arrival of social media ROI.  She cites the Link Like Love platform introduced by American Express. The platform is described as a closed-loop business model. Cardmembers can sync their cards with Foursquare, Twitter and Facebook to get deals and offers from partner companies. Accounts are credited after purchases. The purchase can be tracked to the channel it came from.

In order to measure social media ROI marketers need to understand the strength and weakness of metrics, how to report results, and look at the advantages and disadvantages of the business model. What content is generating leads? How many subscriptions have been added? What platforms have the highest conversions? It takes more than numbers to understand the dynamic of social media and its return on investment.

Do you have a plan or process for measuring social media beyond ROI?

Is Your Website Content Working?

Your website content should increase traffic to your site, generate leads and links, and convert visitors to paying customers. Here are a few simple tools to help you determine if your content is serving its purpose.

Keyword Numbers vs. Keyword Use

Many companies build their content around “optimized” keywords to increase traffic to their site. Google’s Adwords Keyword tool is a popular way to search for the right words. Entering a generic search term like “construction” will provide a list of keywords. Construction company shows 1 million Global Monthly Searches and 450,000 Local Monthly Searches. These numbers reflect searches that include all sorts of other words such as “best” or “jobs” that were added onto the original term – construction company. To get true keyword counts from the Adwords tool, try this.

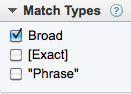
Under the keyword search box select:

On the left column in the Match Types box, change the default setting from Broad to Exact. Try it again by selecting Phrase. You will see the numbers drop to reflect the exact terms and phrases people enter into the search box.

These are the keyword terms you want to build your content with to increase traffic to your site.

Who is Linking to What Content

Some sites create content just in order to build links. Is anyone linking to your site? What about links on your competitor sites? Find out using SEOMOZ Open Site Explorer, a link analysis tool. Enter your URL or a competitor URL in the address box. Review link data on the Top Pages tab and Full List of Link Metrics tab.

Generating Leads With Content

Including links to blog posts, eBooks, whitepapers, brochures, coupons and landing pages can give you quantitative data on the level of visitor interest.

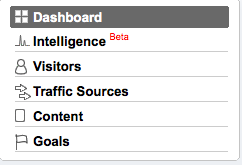
Google Analytics will show how many new and returning visitors came to your site and how extensively they interacted with your content. But do you know which companies are visiting your site and what content is engaging them? From your Google Analytics account Select View Reports to access the Dashboard. From there select Visitors > Network Properties > Service Providers. You will see a list of companies visiting your site.  Add filters to refine this list.

Convert With Content

Which pages have created the greatest conversions and on what pages did visitors act on the call to action? From the Google Analytics Dashboard select Content > Top Content to see how each of your website pages is performing. You will find the average time on site, page views, and bounce rate but also check out the metric under $ Index. This metric offers a way of ranking the content by page. Your page $ index will show what pages are converting. Create custom reports from the Dashboard using Goal > Total Conversions and Conversion Rate to get more precise information.

Content can be improved over time as you learn what works and what doesn’t. Knowing this allows you to make smart decisions when it comes to your website content.